


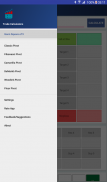

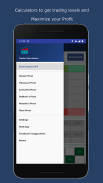

Trade Calculators
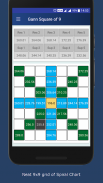
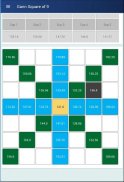
Gann Square of 9 and Pivots
Trade Calculators: Gann Square of 9 and Pivots介绍
Whether you are a price action, a pattern, an indicator or whatever trader, ability to identify strong price levels on your charts can greatly improve the quality and profitability of your trading. Instead of taking false signals and wrong trades, the better trades usually happen at key price levels. Those strong areas of interest show that buyers and sellers are concentrating at those levels and they can be the starting or turning points for new price moves and mark new trends as well.
If you are a breakout trader, you need to find areas that can lead to strong breakouts, if you are a trend-following trader you must identify pullback areas or trend continuation points, a reversal trader looks for key turning points and a range trader should focus on well-developed ranges with clearly defined price levels.
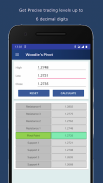
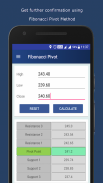
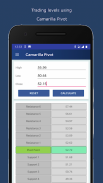
Expert analysts or experienced traders always use certain tools and techniques to ascertain support or resistance level, each of which is important because it represents a point at which a major price movement is expected to occur.
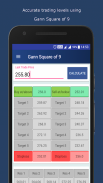
Gann Square of 9 and Pivot Points are hugely popular and used widely. Please use our calculators and precisely determine the trading levels, blend it with technical or other analysis and maximize your profits.
* Our level finding calculators are some great ways to identify areas of support and resistance, but they work best when combined with other kinds of technical analysis
* Trade Calculators is a tool to help you find the levels for support, resistance and targets, however, responsibility for any trades taken based on the levels generated using this tool will solely rely on the user. The developer or the ApverS team will not be held responsible for any losses or gains whatsoever.
* For any Feedback, Suggestions, Bug Reporting, or just to say Hi, please shoot at tradecalc.apvers@gmail.com
Disclosure/Disclaimer
1. This application is only for educational purpose. It uses standard mathematical formulas to determine various support and resistance levels. It does not assure any kind of firm resistance and support values for trading purpose.
2. The user of this application understands the risks involved in trading based on volatility in the market and the universal circumstances. Hence, the User of the application will alone be responsible for trades carried based on levels generated in the application.
3. No legal liability will be taken by the developer in any circumstances for any losses or gains made by using the application.
Tags: Trade Calculators, TradeCalculators, Trading Calculator, Trade, Trading, Calculator, Calculators, Levels, Gann Square Of 9, Pivot Points, Fibonacci Pivot, Camarilla, DeMark's, Woodie's, Floor
无论您是价格行为,模式,指标还是任何交易者,在图表上识别强大价格水平的能力都可以极大地提高您交易的质量和盈利能力。而不是采取虚假信号和错误交易,更好的交易通常发生在关键价格水平。这些强大的兴趣领域表明,买家和卖家都集中在这些水平,他们可以成为新价格走势的起点或转折点,也标志着新的趋势。
如果你是一个突破交易者,你需要找到可以导致强劲突破的区域,如果你是一个趋势跟踪交易者你必须确定回调区域或趋势延续点,反转交易者寻找关键转折点和区间交易者应该专注于明确定义的价格水平的发达范围。
专家分析师或有经验的交易者总是使用某些工具和技术来确定支撑位或阻力位,每一个都很重要,因为它代表了预期会发生重大价格变动的点。
江恩广场9和枢轴点非常受欢迎并广泛使用。请使用我们的计算器并精确确定交易水平,将其与技术或其他分析相结合,并最大化您的利润。
*我们的水平测量计算器是识别支撑和阻力区域的一些很好的方法,但与其他类型的技术分析结合使用时效果最佳
*交易计算器是一种帮助您找到支撑,阻力和目标水平的工具,但是,根据使用此工具生成的水平进行的任何交易的责任将完全依赖于用户。开发商或ApverS团队不对任何损失或收益负责。
*有关任何反馈,建议,错误报告,或只是说你好,请拍摄tradecalc.apvers@gmail.com
信息披露/免责声明
1.此申请仅用于教育目的。它使用标准数学公式来确定各种支撑和阻力水平。它不能保证任何形式的坚定抵抗和支持价值用于交易目的。
2.本申请的用户根据市场波动和普遍情况了解交易涉及的风险。因此,应用程序的用户将单独负责基于应用程序中生成的级别进行的交易。
3.在任何情况下,开发商不会因使用申请而产生的任何损失或收益承担任何法律责任。
标签:贸易计算器,TradeCalculators,交易计算器,交易,交易,计算器,计算器,级别,江恩广场9,枢轴点,斐波那契枢轴,Camarilla,DeMark,Woodie's,楼层
Trade Calculators : Gann Square of 9 and Pivots - 版本1.2.1
(14-03-2020)Trade Calculators: Gann Square of 9 and Pivots - APK信息
APK版本: 1.2.1程序包: com.apvers.tradecalculatorsTrade Calculators : Gann Square of 9 and Pivots的最新版本


同类应用


